
Knowing how to best represent a set of quantitative information is not easy. I strongly recommend a quick read of the Wikipedia entry on Misleading Graphs and if you want to read a whole book try The Visual Display of Quantitative Information by Edward R. Tufte. Instead of remphasizing the need for displaying information in the simplest way possible, I’m going to give examples of how not to display information. Sometimes the errors are only small. But those errors will always be notiable, they affect how people interpret the information. First up, WordPress’s graphs

The problem here is that when the view count is 0 the colour is grey – it should just be a lighter shade of yellow. The sudden shift from 1 as yellow to grey as 0 suggests there is a fundamental difference between 1 and 0. There isn’t, as I explained in my my https://emphatious.wordpress.com/2012/10/12/zero/. Wikipedia correctly uses a colour to show a semantic difference. White is used to represent the fact that there is no information available in the following graph.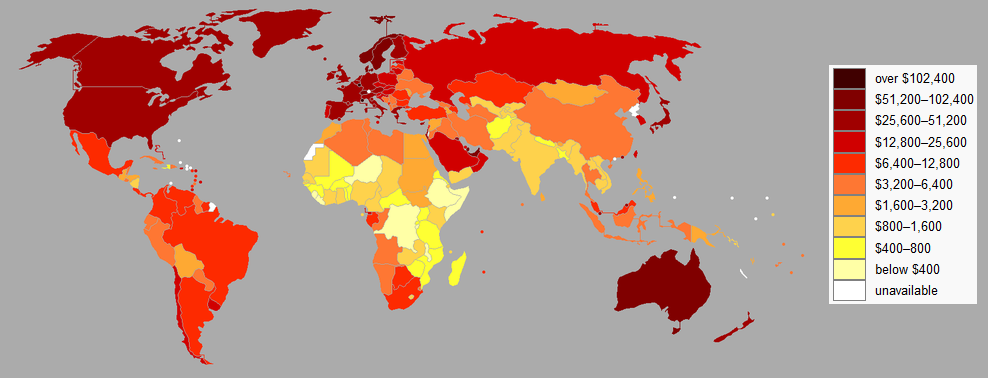
However, this graph isn’t without its own problems. Can you figure out what the problem is? It’s incredibly difficult to realize the problem as it is a very deep one. Think about colours.
The most obvious problem is that the graph does not use a gradient. groups of GDP are lumped together for no reason. There should be no groups. instead of $800-$1600 being one colours, $900 should be a little more red than $850, $950 a bit more red than $900 and so on. They are essentially rounding figured for no reason. If you had a graph showing $11.53 million profit in Q1 and $12.42 million profit in Q2, would you round them? Rounding them serves no purpose. All it does is reduce accuracy… nothing is improved.
There is a much more subtle assumption made by this graph. It might not be wrong but it isn’t explained. The assumption is that the utility of money increases logarithmically. Look at the groups, they increase logarithmically.
The designers of the graph took it upon themselves to change how the information is shown. Instead of something that’s 10x the size quantitatively being 10x brighter or bigger (10x more intense in some way represented visually) on the graphic, they’ve made it log_10 times brighter. That’s an arbitrary operation done without justification. I do expect that if I were to ask the designer of the graphic why he did this, he would reply with the unforgivable line
“because if it weren’t like that, it’d be hardest to tell the difference between countries with low income. For example, almost all of Africa would be very similar in colour”.
GRAPHICS SHOULD NOT BE USED AS A WAY TO SHOW A LIST OF FACTS.
If your goal is to let everyone know the exact GDP of countries, use a table not a graphic.
It is not a dilemma that people would see only a small difference in the colours of African countries because there is only a small difference in the GDP of African countries.
One last puzzle. Can you spot what’s wrong with this graph?

The problem is that again they’ve grouped things together when not necessary. But more importantly, look at the way the “Barely Dem” and “Barely GOP” are coloured. They are different to the others in that their centers are not coloured. This destroys the semantic meaning of the colours of the graph. It was originally that the colour represents the strength of the likelihood but not the colour AND how much white is in the center also represents it, adding complexity without adding any information.
One last error in this graph is that they have changed the size of Alaska. This is only confusing. The graph is being totally warped by the designer who felt that the shape of Alaska was awkward to work with.This makes the graph now entirely subjective. The designer could’ve also changed the shape of all other states – the integrity of the graphic is entirely destroyed by this decision.
